Fleet performance improves when managers measure the right operational signals. A fleet may operate hundreds or thousands of vehicles, yet only a handful of metrics determine whether those assets generate profit, drain resources, or expose the organization to operational risk.
Fleet management metrics function as operational diagnostics. They translate vehicle activity, driver behavior, and maintenance performance into measurable indicators that reveal efficiency, safety exposure, and cost control. When monitored consistently, these indicators provide early warnings of inefficiency, asset failure, and operational misalignment.
Organizations that treat fleet data as a strategic management system—not just a reporting tool—gain the ability to optimize routes, extend asset life cycles, reduce fuel waste, and improve driver accountability. These improvements are driven by a disciplined approach to tracking performance indicators tied directly to operational outcomes.
Fleet metrics generally fall into four strategic categories:
- Financial performance metrics
- Asset utilization metrics
- Maintenance and reliability metrics
- Driver behavior and safety metrics
These measurement systems provide a comprehensive view of fleet performance and enable operational leaders to identify inefficiencies before they become systemic cost drivers.
Fleet management metrics function as operational intelligence systems
Fleet management metrics quantify how efficiently vehicles, drivers, and supporting processes operate across the transportation lifecycle. They translate operational activity into measurable indicators that guide decision-making.
These indicators allow fleet managers to move from reactive problem solving to proactive operational control. Instead of responding to breakdowns, safety incidents, or cost spikes after they occur, leaders can identify patterns early and intervene strategically.
Key outcomes enabled by structured metric tracking include:
- Improved fleet productivity
- Reduced operating costs
- Increased vehicle availability
- Better safety outcomes
- Stronger asset lifecycle management
Performance indicators reveal how effectively fleet resources are deployed and whether operational strategies are delivering measurable value.
Without clear metrics, fleet operations operate in an informational blind spot where inefficiencies remain invisible until they produce significant financial impact.
Total cost of ownership reveals the true financial performance of a fleet
Total cost of ownership (TCO) measures the complete lifecycle cost of operating a fleet asset from acquisition through disposal. It is one of the most important financial metrics in fleet management because it captures the full economic footprint of vehicle operations.
Unlike single-cost metrics, TCO integrates multiple expense categories.
Typical TCO components include:
- Vehicle purchase or lease costs
- Fuel expenses
- Maintenance and repair costs
- Insurance premiums
- Depreciation
- Administrative overhead
When analyzed properly, TCO helps organizations determine whether vehicles are economically viable across their operational lifespan.
Operational insight TCO provides
TCO analysis often reveals hidden inefficiencies that simple expense tracking fails to detect. For example:
- A vehicle with lower upfront cost may generate higher maintenance expenses over time.
- Aging assets may produce escalating repair costs that exceed replacement value.
- Certain vehicle classes may underperform financially due to fuel consumption patterns.
Fleet managers use TCO comparisons to determine when to retire vehicles, adjust acquisition strategies, or optimize asset mix across the fleet.
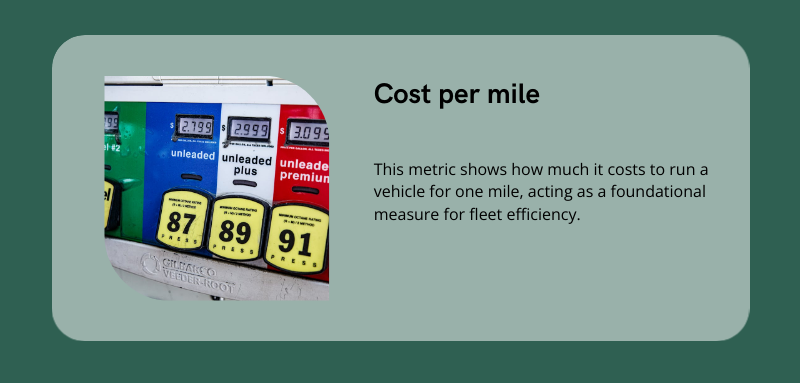
Cost per mile establishes the baseline efficiency of fleet operations
Cost per mile (CPM) measures the total operational cost required to move a vehicle one mile. It is widely considered the foundational economic indicator for fleet performance.
The metric is calculated by dividing total fleet operating expenses by the total miles driven over a given period.
Core CPM formula
Cost Per Mile = Total Operating Costs ÷ Total Miles Driven
Operating costs included in this calculation typically consist of:
- Fuel consumption
- Maintenance and repairs
- Insurance
- Driver wages
- Administrative expenses
Why CPM matters operationally
CPM standardizes performance measurement across vehicles, routes, and operating conditions.
This allows organizations to:
- Compare cost efficiency across fleet segments
- Evaluate route profitability
- Identify underperforming vehicles
- Benchmark operational performance
Even small improvements in CPM can generate significant financial impact when multiplied across large fleets operating thousands of miles per day.
Fuel efficiency metrics expose hidden operational waste
Fuel represents one of the largest operating expenses in fleet operations. In many fleets, fuel consumption can account for a majority of operational costs, making fuel performance a critical metric category.
Tracking fuel efficiency helps identify waste caused by driver behavior, vehicle condition, or routing inefficiencies.
Core fuel performance indicators
The most widely used fuel metrics include:
- Miles per gallon (MPG)
- Fuel cost per mile
- Fuel cost per route
- Idle time percentage
- Fuel consumption per vehicle
Miles per gallon measures how efficiently vehicles convert fuel into distance traveled. Idle time tracks how long engines run without movement, which directly contributes to unnecessary fuel burn.
Operational signals revealed by fuel metrics
Fuel performance data often uncovers operational issues such as:
- Excessive vehicle idling
- Aggressive driver acceleration patterns
- Poor route planning
- Under-inflated tires
- Deferred maintenance issues
Monitoring fuel efficiency across similar vehicles allows fleet managers to identify outliers and implement targeted corrective actions.
Vehicle utilization indicates whether fleet assets are properly sized
Vehicle utilization measures how actively fleet assets are used relative to their available capacity. It answers a critical operational question: are vehicles being used enough to justify their cost?
Low utilization rates may indicate an oversized fleet, while extremely high utilization can increase wear and raise maintenance risk.
Utilization is commonly measured using:
- Miles driven per vehicle
- Engine hours
- Active service time
- Trips completed per day
Operational implications of utilization data
Utilization analysis supports several strategic decisions:
- Fleet sizing adjustments
- Asset reallocation across routes
- Vehicle replacement planning
- Maintenance scheduling optimization
When utilization data is properly analyzed, fleets can eliminate idle assets and redistribute workloads more efficiently.
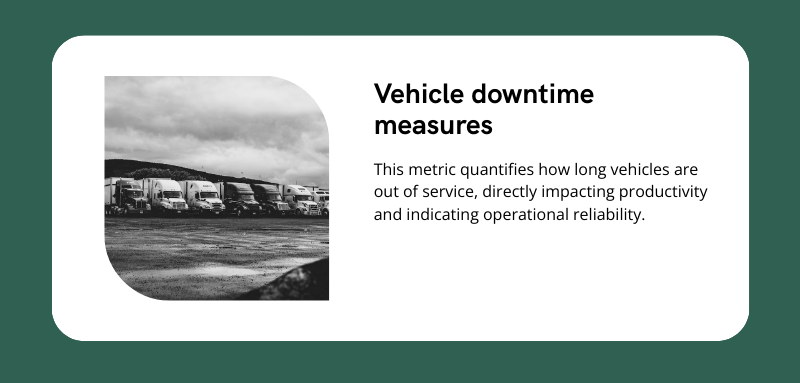
Vehicle downtime measures operational reliability
Vehicle downtime quantifies how long fleet assets remain unavailable due to maintenance, repairs, or operational disruptions.
Downtime directly impacts fleet productivity because every inactive vehicle reduces operational capacity.
Downtime metrics typically track:
- Unscheduled breakdown events
- Maintenance repair duration
- Average repair time
- Vehicle availability rate
Availability rate as a reliability indicator
Availability rate measures the percentage of time vehicles are operational and ready for use.
Availability Rate = (Available Vehicle Time ÷ Total Vehicle Time) × 100
Higher availability indicates strong maintenance planning and reliable asset performance.
Downtime tracking allows fleet managers to identify vehicles that consistently require excessive repairs and may need replacement.
Preventive maintenance compliance protects fleet reliability
Preventive maintenance compliance measures how consistently vehicles receive scheduled service.
This metric evaluates whether fleet maintenance programs are executed according to schedule rather than delayed until problems emerge.
Typical maintenance compliance indicators include:
- Preventive maintenance completion rate
- Average maintenance interval adherence
- Maintenance backlog
- Work order completion time
Operational benefits of maintenance compliance
Consistent preventive maintenance improves fleet reliability in several ways:
- Reduces unexpected breakdowns
- Extends vehicle lifespan
- Improves fuel efficiency
- Enhances driver safety
Organizations that maintain high preventive maintenance compliance generally experience fewer service disruptions and lower long-term repair costs.
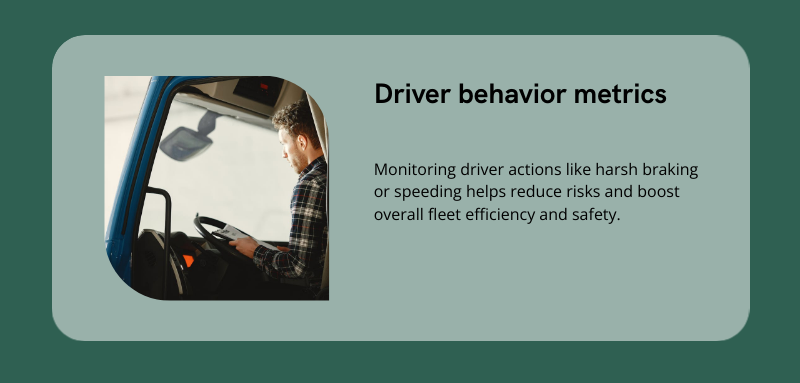
Driver behavior metrics reduce risk and improve efficiency
Driver performance has a measurable impact on safety, fuel consumption, and vehicle wear.
Fleet operations increasingly rely on telematics systems to monitor driver behavior and identify risky driving patterns.
Driver behavior metrics typically track:
- Harsh braking events
- Rapid acceleration
- Speed violations
- Excessive idling
- Unsafe cornering
These indicators allow organizations to evaluate driving habits across their workforce and implement targeted training programs.
Operational value of driver performance tracking
Driver behavior monitoring improves fleet performance by:
- Reducing accident risk
- Improving fuel economy
- Lowering insurance costs
- Extending vehicle component life
Safety-focused driver metrics also play an important role in regulatory compliance and liability management.
Safety incident rates reveal systemic operational risk
Safety metrics track the frequency and severity of incidents involving fleet vehicles.
Accidents introduce financial, legal, and operational consequences that extend far beyond repair costs.
Safety incident metrics often include:
- Accident frequency rate
- Preventable accident rate
- Near-miss events
- Driver safety violations
- Insurance claim frequency
Tracking safety incidents allows organizations to identify high-risk routes, vehicle types, or driving behaviors.
The resulting insights enable proactive interventions that improve safety culture across the fleet.
Maintenance cost per vehicle highlights long-term asset health
Maintenance cost per vehicle measures how much each asset requires in ongoing repair and service expenses.
This metric provides insight into the aging characteristics of vehicles and helps determine whether assets remain financially viable.
Maintenance cost metrics typically include:
- Average repair cost per vehicle
- Maintenance cost per mile
- Parts cost per vehicle
- Labor cost per repair
When analyzed over time, these metrics reveal whether maintenance expenses are rising beyond acceptable thresholds.
Vehicles that consistently exceed maintenance benchmarks may require replacement or reassignment to less demanding routes.
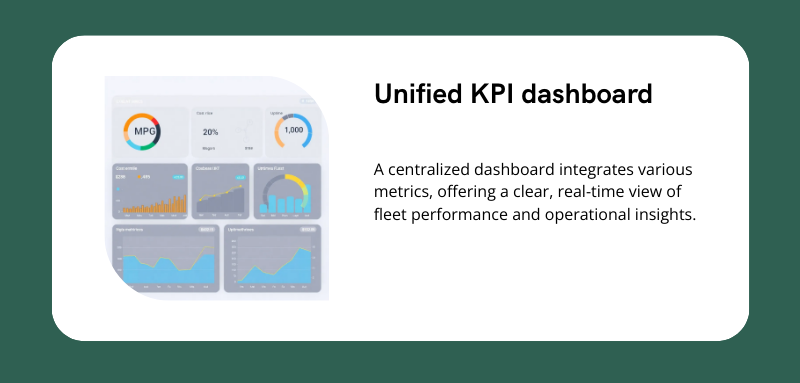
A unified KPI dashboard creates operational visibility
Fleet metrics generate the greatest impact when integrated into a unified operational dashboard.
Rather than analyzing isolated metrics independently, fleet leaders combine indicators into a comprehensive performance framework.
An effective fleet dashboard typically integrates data from:
- Telematics systems
- Fuel card platforms
- Maintenance management software
- Driver monitoring tools
- route planning systems
This integrated approach provides real-time operational visibility and allows managers to detect inefficiencies as they emerge.
Example fleet KPI framework
| KPI Category | Core Metrics | Operational Purpose |
| Financial | Cost per mile, TCO | Cost control |
| Asset utilization | Vehicle usage rate | Fleet sizing |
| Maintenance | Downtime, PM compliance | Reliability |
| Fuel efficiency | MPG, idle time | Cost optimization |
| Safety | Incident rate | Risk management |
| Driver performance | Behavior events | Safety and efficiency |
When analyzed collectively, these indicators provide a holistic understanding of fleet performance.
High-performing fleets rely on a small set of critical metrics
Fleet management generates vast quantities of operational data, but only a subset of metrics consistently drives strategic improvements.
High-performing fleets typically prioritize a focused group of indicators:
- Total cost of ownership
- Cost per mile
- Fuel efficiency
- Vehicle utilization
- Downtime and availability
- Preventive maintenance compliance
- Safety incident rate
Monitoring these metrics consistently allows organizations to maintain operational discipline while avoiding data overload.
The objective is not to track every possible measurement but to focus on the indicators that directly influence cost, safety, and reliability.
FAQ: Fleet Management Metrics
What are fleet management metrics?
Fleet management metrics are measurable indicators used to evaluate the efficiency, safety, and cost performance of vehicle fleets. These metrics help organizations monitor vehicle utilization, fuel consumption, maintenance performance, and driver behavior.
What is the most important fleet management KPI?
Cost per mile is often considered the foundational fleet KPI because it captures the overall operating efficiency of a fleet by combining multiple expense categories into a single performance metric.
How do fleet managers measure vehicle utilization?
Vehicle utilization is typically measured using miles driven, engine hours, or active service time relative to the total available time for a vehicle.
Why is fuel efficiency important for fleets?
Fuel efficiency directly impacts operating costs and environmental impact. Tracking fuel consumption metrics allows fleets to identify inefficient vehicles, poor driving habits, and routing inefficiencies.
What metrics help reduce fleet downtime?
Preventive maintenance compliance, repair cycle time, and vehicle availability rate are key metrics used to monitor downtime and maintain fleet reliability.
How do driver behavior metrics improve fleet safety?
Driver behavior metrics track events such as harsh braking, speeding, and rapid acceleration. Monitoring these behaviors allows organizations to implement training programs that reduce accident risk.
What is fleet total cost of ownership?
Total cost of ownership measures the full lifecycle cost of operating a vehicle, including purchase, fuel, maintenance, insurance, and depreciation expenses.
The fleets that master operational metrics will dominate efficiency
Fleet operations are increasingly shaped by data-driven management rather than intuition or historical practice. The organizations that treat fleet metrics as strategic intelligence—not simple reporting tools—gain a measurable advantage in efficiency, safety, and cost control.
As telematics systems, predictive analytics, and integrated fleet platforms continue to evolve, operational leaders will gain even deeper visibility into vehicle performance and driver behavior. The fleets that learn to interpret these signals effectively will transform operational efficiency and redefine what high-performing transportation systems look like.